

110. SPN (Some Personal News)
110. SPN (Some Personal News)
Protect your budget - metrics to align on with your CFO - show the impact of Brand and Fundraising activities on immediate & long-term revenue; A/B test ad copy with RSAs; and some great Jobs

A very warm welcome to all the new subscribers. I’m thrilled to have you as readers and truly appreciate your feedback and support.
Managing user access can be a headache.
Fundraise Up’s single sign-on (SSO) integration makes it easier than ever to manage and keep your Org’s data secure.
If your Org uses IdPs like Okta, Google SSO, Microsoft Entra ID, Auth0, ADFS, or any other that supports SAML 2.0, integrating with Fundraise Up's SSO is a breeze.
Say goodbye to the hassle of user access management and hello to upgraded security!

In this week’s SPN:
How to A/B test Ad copy with Responsive Search Ads (RSA)
Metrics that measure the impact of Brand and Fundraising activities on immediate and long-term revenue
Jobs that took my fancy this week
How to A/B test Ad copy with RSAs
Ad copy A/B testing is one of the most impactful and important tasks for any campaign or outreach. It can inform direct mail, major donor outreach, positioning. But it’s incredibly hard with Responsive Search Ads, automation, and limited insights. Since I haven’t written a tactical, step-by-step post in a while - here we are!
What if I told you there’s another way?
RSAs have made ad copy A/B testing impossible
A few years ago, when (Expanded) Text Ads were still a thing, you could run very granular ad copy A/B tests with small variations.
But that’s become completely impossible with Responsive Search Ads (RSAs). You add up to 15 headlines and 4 descriptions and let Google do the testing for you.
As a result:
A few headlines get 70-90% of impressions
Most are left untested
You get no real performance data
Here’s an example of the limited insights RSAs give us, even with 100K+ average impressions per Responsive Search Ad. Everything just gets labeled as “good” or “learning” - beyond frustrating.

It’s even worse in small accounts. You need FAR too much data to get statistically significant insights, which makes ad copy A/B testing completely impossible.
But wait! There’s another way.
How to run ad copy A/B tests with Ad Variations
There’s a hidden feature in Google Ads called “Ad Variations”.
With Ad Variations, you can A/B test specific elements of your ads (headlines, descriptions, even landing pages). And you get REAL data - plus an indicator if your test is statistically significant.
Here’s how to use Ad Variations →
Step 1: Navigate to Ad Variations
1.1: Go to “Campaigns”, then click “Experiments”
1.2: Click on “Ad Variations”
1.3: Click the “+”

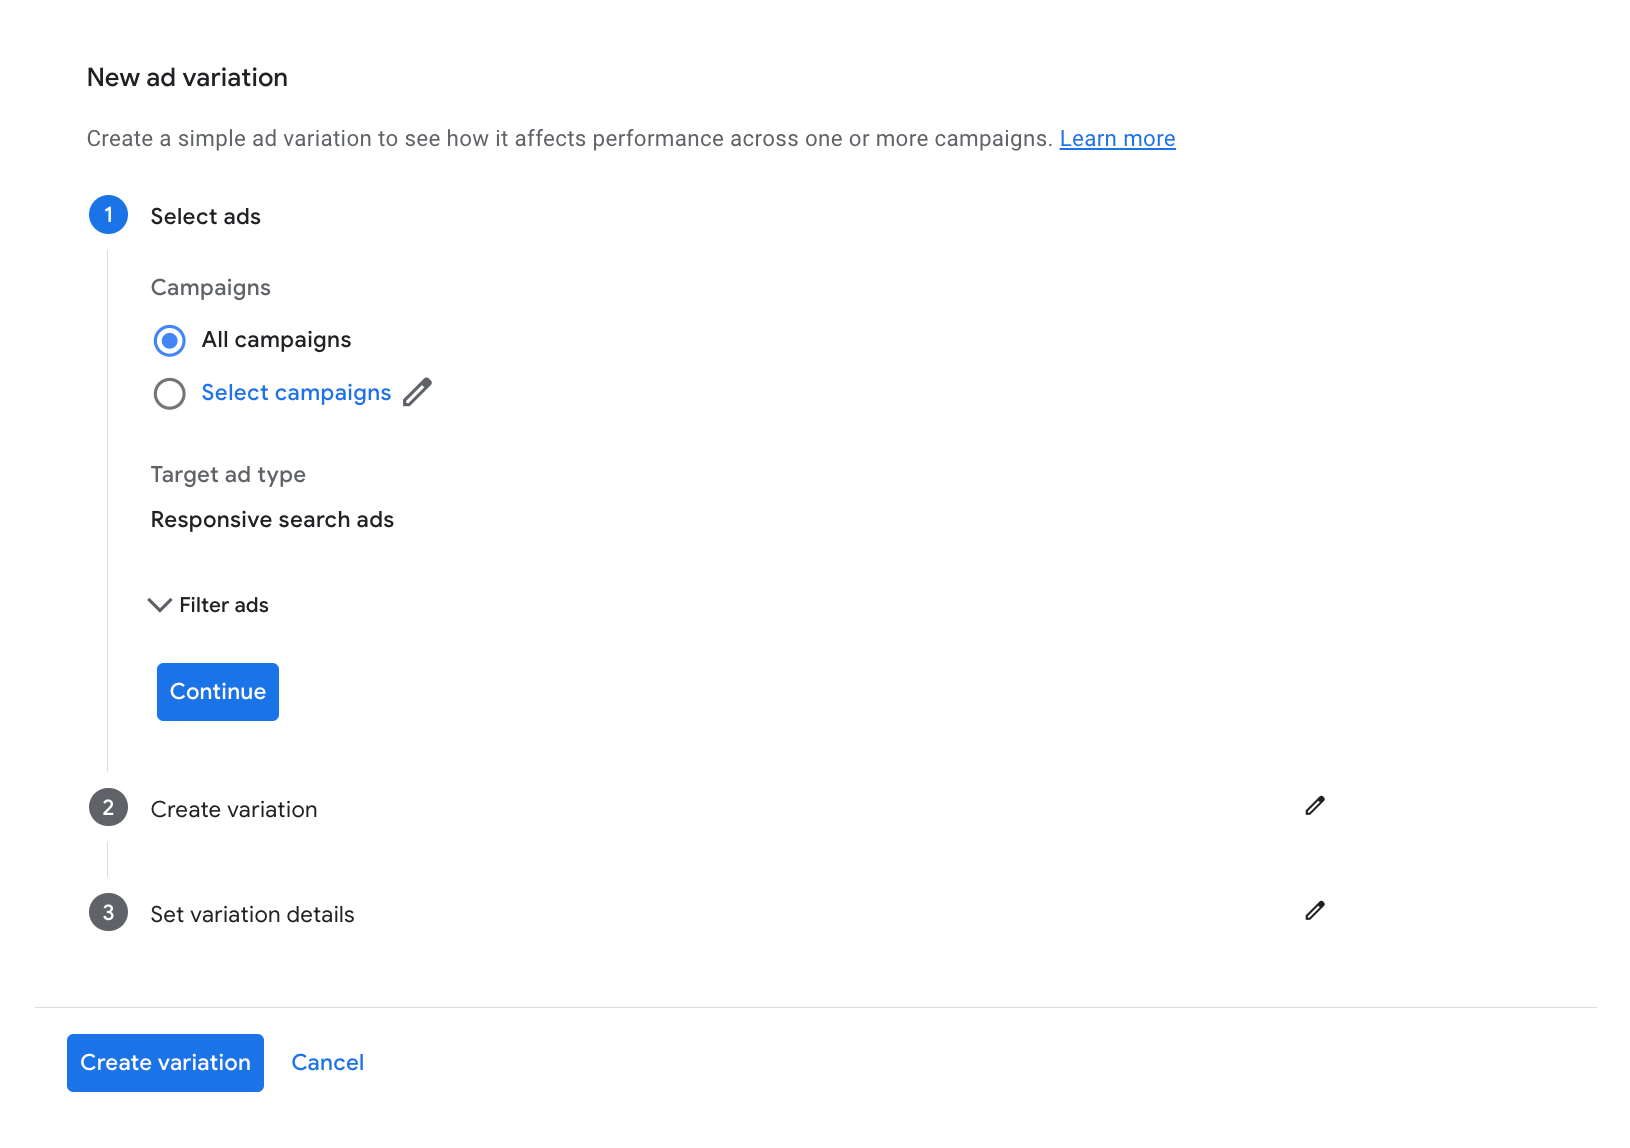
Step 2: Set up your Ad Variation
2.1: Select Ads
Choose the right campaigns.
Optional: set up a filter (if you only want to test ads with a specific headline, description, final URL or path.
Click “continue”.
2.2: Create variation
Choose the type of variation you want to apply to your ads:
Find and replace: finds and replaces a specific text (see example below where you could test “Buy now” vs. “Shop now”, or Donate vs Give or anything like USPs, CTAs, keywords etc).
Update URLs: sets a new URL to test with.
Update text: choose what you want to edit (headlines/descriptions) and what you want to test (add/remove/pin).
Find and replace is my personal favorite because it’s the easiest way to isolate ad copy and do proper A/B tests (impossible with regular RSAs).

2.3: Set variation details
Add a name.
Set a start and end date (you used to be able to run tests without an end date but as of now the max duration is 84 days).
Set up your Experiment split (in most cases 50% is perfect).
2.4: Click “Create variation” to launch your Ad Variation
Ta-Da → you’ve launched an Ad Variation
All you have to do now is sit back, wait, and gather data.
When you click on your Ad Variation name, you’ll get a deep-dive of the data and results of your experiment.
See (1) below for overall performance comparison between your control and experiment ads. If you hover over the data you’ll see your statistical significance (if you see a blue star, it means your test is statistically significant for that specific metric).
And see (2 ) for the performance data by campaign/ad group/ad.

A/B test ad copy with RSAs
Your digital team should now have a new and powerful weapon in their arsenal! Play around with Ad Variations and start A/B testing. And just to repeat, I love the find and replace function because it allows you to isolate tests (which is crucial for proper A/B testing).
Here’s a few examples of what you can test:
Landing page tests
Lower case vs. Upper case
USP vs USP
CTA vs CTA
Pinning vs. Unpinning
Keywords vs. no keywords
These are just examples. Implement the above steps and you can now test anything that takes your fancy!
Jobs & Opps 🛠️
United Nations Office for Disaster Risk Reduction: Digital Content Expert for regional activities in the Americas and the Caribbean (Consultant)
Fine Arts Museums of San Francisco: Chief Marketing Officer ($220,000 - $260,000)
CodePath: Director, Institutional Giving ($130,000 - $150,000)
God's Love We Deliver: Chief Growth & Strategy Officer ($185,000 - $225,000)
Center for Disaster Protection: Associate Director - Growth and Operations (£80,000 - £100,000)
UnidosUS: Deputy Vice President, Learning & Impact ($175,000 - $200,000)
Comic Relief: Foundations and Institutional Fundraising Lead (Interim) (£53,000 - £60,000)
UNICEF (GIGA): Advocacy and Internal Comms Specialist (12 month Consultancy)
American Cancer Society: SVP, Marketing ($210,000 - $240,000)
TED Conferences: Director, Portfolio Impact ($175,000 - $195,000)
Protect your Budget, Align on Metrics
It’s been estimated that Orgs could lose up to 60% of their fundraising revenue from third-party cookie deprecation. Unprepared fundraisers beware. But that’s old news.
The silent, much less talked-about “victim” of this cookieless future is your budget. This risk needs to be talked about and managed upfront, which means Brand, Performance and Finance teams must sing from the same hymn sheet.
That triumvirate is often a dysfunctional dynamic in most Orgs where communication and alignment is lacking:
Brand Marketers: use ad recall and brand awareness as metrics to make significant budget shifts.
Fundraisers: extrapolate the first month of repeat donations into a 12-month revenue to boost reported RoAS regardless of average churn rate.
The CFO’s office: assess marketing and fundraising investments + revenue generation in the span of the same month.
Our sector seems to have got used to this dysfunction, even accepting of it - and often try to manage around it with varying attribution look-back windows. That dance can be unpredictable and CFOs end up cutting budgets.
Inevitably this leads to a decline in funds raised, further fueling the vicious cycle of budget cuts, wrongfully decreasing the role of digital fundraising, and preventing many great Orgs from realizing their full potential.
What a dire situation. And I see it playing out in multiple Orgs especially when there aren’t unified KPIs in place. There’s a misalignment in how these three vital roles see the world:
The Chief Marketing Officer is KPI’d on attracting future supporters and operates independently. There’s no one magical impression to which the impact of brand efforts can be attributed, and they can be far removed from a potential donation on any timeline.
The Chief Revenue Officer (Advancement/Fundraising/Development) and their team are KPId on attracting immediate donations and operate independently.
The Chief Financial Officer and their team are focused on expense line items’ direct and predictable impact on revenue, regardless of the timeline.
Attribution models created a myth of resolving this conflict but were never a real solution. So - what is?
All three teams are ultimately servicing the donor lifecycle:

The Brand Marketing team serves the donor until they visit the website.
Brand overlaps with the Fundraising Team before “handing the donor off” until the end of the lifecycle (and beyond for reactivation campaigns).
The Finance Team, on the other hand, “sees” the donor only as long as they’re actively transferring money to the Org.

Though this view eliminates time from the equation and orientates the relationship around the donor lifecycle, the direct/indirect relationship conflict still stands.
Here are 5 Metrics to Illustrate Impact on Revenue
Through working with various Orgs to eliminate this misalignment, I’ve developed a set of metrics to help the Finance Team better see the impact of Brand and Fundraising activities on immediate and long-term revenue.
Let me know what you think of these:
Brand Metric: Increase in branded search queries on search engines, YouTube, and social networks. Instead of using hard-to-explain brand lift studies, this is my favorite hardcore metric to show a direct impact of spending money at the top of the funnel on the actions downstream.
SPN Tip: Measure it every three months by running a random A/B test for a particular brand campaign, excluding several states from the mix and not changing targeting. Compare the brand search query volume increase (decrease) in test states versus others, calculating the “cost per incremental brand search.”
SPN Tip 2: Calculate the “average value of the brand search query,” multiplying the average donor lifetime value by the brand search conversion rate.
Brand metric: Likely prospective donor count, defined as the number of donors interacting with at least three brand ads over time and across channels. “Interaction” requires explicit action from the donor, not just “time the ad was on screen” e.g. metrics such as subscriptions to the Facebook page, clicks on a paid search ad, or explicit click to play the video in a programmatic ad.
SPN Tip: As with the increase in brand search queries, “likely prospective donors” can be assigned a numerical dollar value by looking at the historical data and multiplying their lifetime value by the conversion rate.
Brand & Fundraising metric: Visitor lead score. Take a page from the B2B marketing playbook, define the lead score for the website visitor in the range of 1-4 based on their most recent session on the website:
Visitors who bounced immediately and browsed no more than one page.
Visitors who reviewed multiple pages, all of which were informational - “About Us,” impact or financial reports, etc.
Visitors who visited one or more donation pages but didn’t interact with the form.
Visitors who interacted with the form but still need to finish a donation.
SPN Tip: The value of each of these categories can be calculated using historical lifetime value multiplied by conversion rate, and should be refreshed quarterly.
Fundraising metric: Post-donation web visit (defined as a visitor who returned to the site after making a one-time donation but didn’t donate again nor converted to a recurring donor). Unlike with the pre-donation visitors, I don’t usually assign these visitors a lead score.
SPN Tip: This metric can be further split into the “post-emergency donation visitor” and “post-non-emergency donation visitor” to address different stages of the donor lifecycle for Orgs heavily impacted by emergencies.
SPN Tip 2: Instead of assigning a lead score, this metric can be broken down into recency segments.
Fundraising metric: Post-churn web visitor. Similar to the previous one, this metric identifies donors who have returned to the website after churning from a recurring donation schedule.
All these five metrics also describe key transitory stages in the donor lifecycle:

And all five of the metrics above can be calculated using most web analytics tools - paid or free versions of Adobe and Google will suffice. Further, they don’t require attribution modeling and can be calculated by creating last-click events - the only model remaining accurate in the future.
Final thought - assign a monetary value to each of these metrics based on hard-to-argue-with historical conversion rates.
That’s all for today!
If you enjoyed this edition, please consider sharing with your network. Thank you to those that do.
If a friend sent this to you, get the next edition of SPN by signing up below.
And huge thanks to this Quarter’s sponsor Fundraise Up for creating a new standard for online giving.
Now onto the interesting stuff!
Reads From My Week
Some Ad Tech Vendors Pulling Back From Google’s Privacy Sandbox Amid Uncertainty (Digiday)
Testing the Impact Of Buy Now, Pay Later Across 150,000+ Checkout Sessions (Stripe)
Canva CEO Melanie Perkins Thinks the Design World Needs More Alternatives to Adobe (The Verge)
TV Ratings and the Election (State of Screens)
2024 Zero-Click Search Study (SparkToro)
Billions Of Google Redirects To Stop Working Next Year (Search Engine Land)
AI Industry Needs To Earn $600B Per Year To Pay For Massive Hardware Spend (Toms Hardware)
The $20B Sports Media Problem No One Can Answer (Bloomberg)
Record TV Streaming in June (Bloomberg)
Infographic: Nonprofit Tools Landscape
Click on this interactive infographic to explore the Nonprofit Marketing and Fundraising Tools landscape (Pledgr).
