


151. SPN: The Swiss Army Knife of Fundraising Analytics
Plus, inspiring Battersea Dogs Home creative; connecting DX to purpose; plenty of Jobs & Opps

A very warm welcome to all the new subscribers.
You’ve joined a community of nearly 3k marketing and fund raising operators at mission-driven Org’s. I’m thrilled to have you as readers and truly appreciate your feedback and support.
In this week’s SPN:
GA4: turning web analytics into a decision-making engine
A new platform that lets users delegate their online (fundraising?) tasks to AI
5 dashboards to build and 4 metrics to toss
Targeting AI chatbots as donors switch from Google search
and, plenty of Jobs & Opps that took my fancy this week
Let’s jump in!
When Digital Strategy Meets Revenue Growth
24% increase in recurring revenue.
99% donor retention during migration.
$2.3M CAD in new income from mobile wallets.
These aren’t stretch goals - they’re actual results the Canadian Red Cross achieved after switching to Fundraise Up.
Fundraise Up’s donation platform gave CRC the modern tools they needed to grow recurring giving: frictionless checkout, upsell nudges, and a self-serve donor portal.
Digital transformation doesn’t have to be slow, risky, or manual.
It does, however, need the right tech!👉 Explore the Fundraise Up platform.
Game-changer? You know it is.

AI & Digital Experiences
The big thing in AI this week? Maybe the Meta announcement of their new AI app? You can watch Uncle Zuck intro it here in a reel. And the WSJ put out a little more background under the headline Meta Launches New Standalone AI App, Rivaling ChatGPT - which seems a little over blown. It’s really just Meta catching up.
Or is it this paper on Era of Experience? Written by a Google researcher the paper argues we’re entering the third era of AI - building on Alpha Go and ChatGPT with a way to sidestep the scarcity of training data by having AI learn from experience.
The impact of AI on fundraising is going to be profound and the big players continue to roll out tools - and hiring accordingly. Congrats to Nathan Chappell and Virtuous.
Visa shared that they partnered with AI giants to streamline online shopping. I’d argue donors have the same need today:
New research from the FT this week was a good reminder that search is in flux - Brands targeting AI chatbots as people switch from Google search. Now, more than ever, harnessing the power of AI to craft digital experiences powerful enough to connect people to purpose will be the difference-maker. I wrote about how to prepare for an SGE-driven donor experience in SPN #95 - probably worth another read.
Research from consultancy Bain found that 80% of consumers now rely on AI-written results for at least 40% of their searches, reducing organic web traffic by up to 25%. Check your Org’s GA4 stats (more on that below). About 60% of searches now end without the users clicking through to another website.
However, Google’s parent company Alphabet just announced its core search and advertising business grew almost 10% to $50.7bn in the first quarter of the year. Billion!
And Perplexity CEO says its browser will now track everything users do online to sell ‘hyper personalized’ ads...
From “Analytical” to “Aww!”

“Look Ahead” is an outdoor competition that media agency Global host with Transport for London and Battersea Dogs & Cats Home scooped the Create Change category.
The competition brief challenged entrants to push the limits of digital OOH media - transform the medium into a strategic bottom-to-top story for outdoor spaces.
Congrats to Battersea Dogs & Cats Home - one of the UK’s oldest and best known animal rescue centers - and readers of SPN too! - who nailed their entry. WINNERS!
And a mighty clever idea → show and tell rescue animals’ journeys to their forever homes with millions of commuters as they make their own way home. Battersea set the campaign exclusively for evening display too, featuring the message “As you make your way home.” In the winning verdict blurb judges praised that journey home aspect, and highlighted its strong integration with the media platform - talk about a highly contextual idea!

The judging panel said that Battersea shared a narrative that resonated so deeply with them that it shifted the energy in the room from analytical to “awww”! One line I read was “If you walked into the station and saw it, you’d just immediately feel the impact.” Bravo! 👏
The campaign is also set to incorporate interactive elements i.e. visuals of adopted pets whose fur appears to blow in sync with tube arrivals and departures!! If I needed another excuse to return to London this summer then this is it!
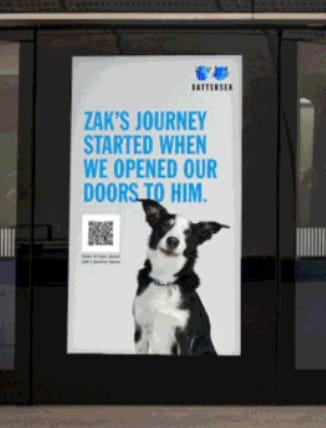
For two weeks Battersea’s winning concept will dominate the gateways, runways, and escalator ribbons at Bond Street, Tottenham Court Road, and Farringdon Elizabeth line stations.
Jobs & Opps 🛠️
Central Park Conservancy: Senior Vice President for Communications & Marketing ($250,000 - $275,000)
Mozilla Foundation: Manager, Grassroots Fundraising ($102,200 - $143,615)
UNICEF Canada: Senior Officer, Individual Giving (Retention) ($51,000 - $60,000)
HumanGood: SVP, Philanthropy ($200,000 - $265,000)
International Justice Mission: Global Director, MarComms
REI: Vice President, Integrated Marketing
Make-A-Wish Foundation of America: Manager, Peer to Peer Fundraising
United Nations Foundation: Director, Partnerships & Strategic Initiatives
National Grid: Head of Social Impact & Community Engagement Operations ($203,000 - $258,000)
charity: water: VP, Global Partnerships
Protect Democracy: Director, Partnerships ($182,000 - $257,000)
ADL: VP, Leadership & Volunteer Engagement ($200,000 - $225,000)
→Plenty more jobs on SPN’s sister site: www.pledgr.com
Google Analytics 4: The Swiss Army Knife of Fundraising Analytics
There are only a handful of genuinely indispensable tools for digital fundraising teams.
Google Analytics 4 (GA4) - even the free version - is undoubtedly one of them. Its functionality far exceeds simple web traffic volume measurement, punching way above its weight.
Correctly set up, GA4 can become your Org’s Donor Analytics Platform, Dashboarding Platform, Remarketing Audience “DMP”, Donor Journey and Lifecycle Analytics Tool, Marketing Analytics Tool and Website Analytics Tool all in one:
Donor Analytics Platform, acting as a basic audience research tool across demographic and psychographic dimensions.
Dashboarding Platform, centralizing several key dashboards for all team members to use daily.
Remarketing Audience “DMP”, creating, administering, and distributing remarketing audiences across Google-owned advertising platforms. For small Orgs without multi-platform budget figures, Google stack (a walled garden with lots of moral and monopoly repercussions) offers an unmatched level of capabilities for no (explicit) cost.
Donor Journey and Lifecycle Analytics Tool, tracking donors’ journey on the website and progression from prospects to one-time and recurring donors.
Marketing Analytics Tool, evaluating channels, campaigns, and creative performance.
Website Analytics Tool, diagnosing the website's conversion rate bottlenecks and technical issues.
3 Essential Metrics x 3 Dimensions to Watch:
Dimensions:
Session Source / Medium - the most accurate dimension for last-click donation attribution. Most Orgs still rely on last-click attribution in internal CRMs / revenue tracking systems but using the Source / Medium report in GA4 allows you to get as close as possible to that view in real time for faster decision making e.g. what ask follows what behavior, when?
First User Campaign - The opposite of last click, this dimension highlights the “first click” a user had to get onto your Org’s website. It’s immensely valuable for scaling donor prospecting campaigns.
Event Name - unlike “total events”, “individual events” are the absolute holy grail of data. Use it to slice and dice the conversion rate further by steps in the donor journey.
SPN Tip: The most important events for every Org to track are the “engagement stages” before somebody becomes a donor. My list of 5 is:
“About Us” page visit
Any 4-page visit
Donation form visit
Monthly donation (separate from one-time)
Any video view
Metrics:
Sessions – the most accurate, deterministic volume measure for each channel, campaign, device, location, etc. Use it instead of “Users” on every possible occasion.
Revenue per Session – a much better metric than “conversion rate” that helps you measure actual dollars brought in by every session instead of donations.
Donor Retention Rate (calculated as “returning users donating again”) is a much faster way to compare recurring vs. one-time donors than pulling data from the CRM. This is the only metric I use the “users” number for.
Caveat Emptor! Like any powerful tool, GA4 can quickly overwhelm your team with meaningless metrics and become a time suck instead. Here’s a shortcut through that noise ->
4 Metrics That Distract:
Bounce Rate - Bounce rate in GA4 is tricky. Classic bounce rate is a “number of sessions with no interactions” divided by “total number of sessions”. In GA4, it’s the inverse of “engaged sessions” – a made-up metric, defined by Google as “a session that lasts longer than 10 seconds, involves at least one conversion event, or includes at least two page or screen views”. The devil is in the details – for most Orgs’ websites, bounce rate is inflated since every landing page visit from paid ads with no donation will most likely be a “bounce”. The time counter doesn’t work for a single-page session, no donation means no conversion, and there are no two pageviews on the landing page.
Users (especially Total Users) - GA4 user counts are modeled (blended between deterministic and probabilistic data). Precise user counts aren’t available and will change depending on the particular dimension chosen for the report. Sessions remained a deterministic metric. Key ratios such as conversion rate should be created as custom metrics, dividing “donations” by “sessions.” The Default Conversion Rate metrics are calculated using the modeled “users” metric instead of the deterministic “sessions” metric.
Average Engagement Time, sitewide - this metric seems insightful. Still, it’s flawed as it’s calculated off the wrong time counter, off the modeled “users” number instead of “sessions”, and can vary between report instances due to inaccurate modeling. Use it only with a “page” dimension.
Total “Events” - event tracking is an excellent feature, but most Orgs have too many events, counting scrolls past a certain point, clicks of a random button, or a 3-page session as an event. Looking at “events” as a metric – by session, user, or page – leads to wrong decisions based on inflated, meaningless metrics.
5 Dashboards I Build in GA4 to Drive Decisions:
Website “Health” Dashboard: A quick view of the website’s technical health to identify anomalies beyond 404 errors.
Dimensions: Device Category, Landing Page
Metrics: Sessions, Engagement Time by Landing Page, Load Time, Error Events
Graphs (all on a 14-day rolling scale):
Traffic volume line graph (Sessions over Time)
Engagement time bar chart (Top Landing Pages by Avg Engagement Time)
Load time table (Landing pages by Avg Load Speed)
Error count (Event Type, count by URL)
Donor Journey Dashboard – view of the in-session donor behavior.
Dimensions: Landing Page, Next Page Path, Event Name, Source / Medium
Metrics: Sessions, Revenue per Session
Graphs:
Funnel visualization (Landing Page > Donation Start > Donation Complete)
Heatmap (Session drop-off rate by page)
Sankey diagram (Typical paths from entry to conversion)
Bar chart (Sessions by Channel by Landing Page, Sessions by Channel by Campaign, Sessions by Channel by Audience)
Donor Lifecycle Dashboard – view of the cross-session donor behavior as they progress from first donation to lifetime value.
Dimensions: Audience (New vs. Returning, Monthly vs. One-time), Campaign, Session Source
Metrics: Returning User Revenue Per Session, Revenue per Returning Session
Graphs:
Retention cohort analysis (Monthly returning donors over time)
Revenue breakdown pie chart (Monthly vs. One-time)
Line graph (Conversion Rate by Donor Audience)
Bar chart (New Users by Channel by Landing Page, Returning Users by Channel by Landing Page)
Digital Marketing Performance Dashboard – by-channel performance view, mostly matching the source of truth with real-time data availability.
Dimensions: Session Source / Medium, First User Campaign
Metrics: Sessions, Revenue per Session, CPA
Graphs:
Horizontal bar chart (Revenue per Session by Source / Medium)
Line graph (CPA trends by Campaign)
Table (Campaign by Sessions, Revenue per Session, CPA, Revenue)
Donor Insights Dashboard – identify high-level audience view
Dimensions: Audience Name, Device Category, Landing Page
SPN Tip: “Audience Name” is a custom dimension you create using filters. I usually start from a basic demographic breakdown (age, gender) + First User Campaign.
Metrics: Revenue per Session
Graphs:
Table (Audience segments ranked by Revenue per Session)
Scatter plot (Engagement Time vs. Revenue per Session by Audience)
GA4 isn’t about “reporting.” It’s about turning web analytics into a decision-making engine for your fundraising campaigns. If you can’t act on something, don’t measure it.
OK, that’s all for today.
I hope you’ve found one nugget today that you can put into play next week.
If you enjoyed this SPN, please consider sharing with your network. Thank you to those that do.
If a friend sent this to you, get the next edition of SPN by signing up below.
And huge thanks to this Quarter’s sponsor Fundraise Up for creating a new standard for online giving.
Now onto the fun stuff!
Weekly Reads 📚
How AI Agents Will Reshape Retail Loyalty Programs (Medium)
WhatsApp’s new Netflix doc on F1 is a master class in turning advertising into entertainment (Fast Company)
There’s a Feeling We’re Not in Hollywood Anymore (NYT)
Spotify Has Paid More Than $100 Million to Podcasters to Take On Competitors - is this sustainable? (Mashable)
Humans as 'luxury goods' in the age of AI (Choudary)
How Facebook Marketplace Became Ubiquitous, Essential, and Unhelpful (Dwell)
Apple aims to source all US iPhones from India in pivot away from China (Guardian)
Big Tech Braces for Tariff-Induced Advertising Slowdown (WSJ)
Is the era of brand over: Scott Galloway vs Rory Sutherland on the Uncensored CMO podcast
Google will soon start letting kids under 13 use its Gemini chatbot (Tech Crunch)