

101. Some Personal News (SPN)
101. Some Personal News (SPN)
What constitutes a "good" retention rate?

A very warm welcome to all the new subscribers. I’m thrilled to have you as readers and truly appreciate your feedback and support. In many parts of the world it’s a Holiday weekend so wherever you’re reading this I hope you’ve got your feet up.
Are you leveraging AI to personalize your Org’s giving experience and maximize your fundraising efficiency?
Fundraise Up’s suggested donation amounts are powered by AI and generated using behavioral learnings from millions of donors.
Using their powerful technology our conversions and revenue charts looked like this 🏒
Game changer? It was for me.

In this week’s SPN:
Adtech has to grow up
What constitutes a “good” retention rate
Jobs that caught my eye
Let’s dig in!
Ads & Adtech
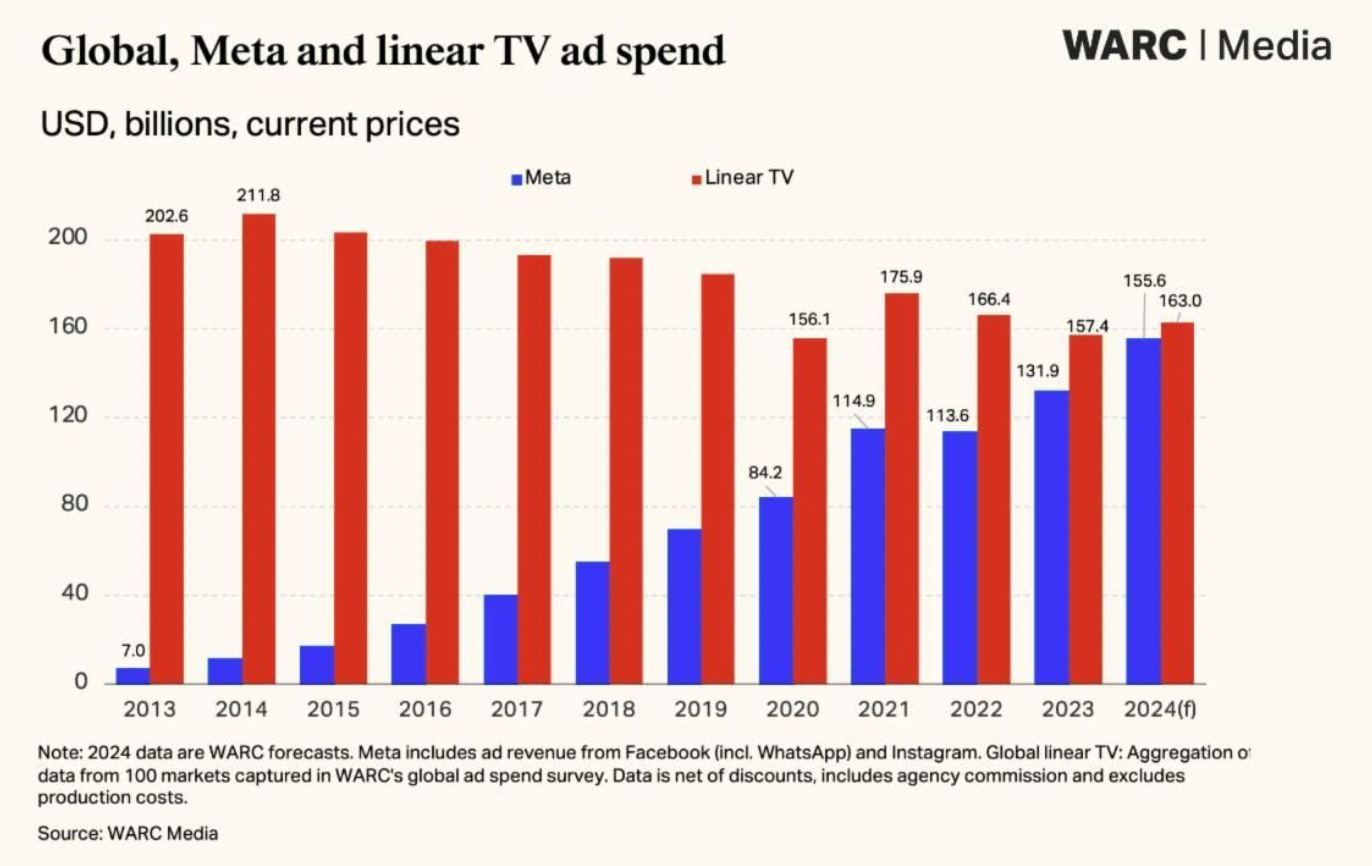
Seeing this chart was a real “holy s**t” moment.
The WARC team (global trade org for advertising and marketing) dropped a new report on social media earlier this month, with some astounding numbers around Meta. I knew that Meta had had a brilliant couple of years. And I knew that linear TV had had more than a couple of not-so-brilliant years.
What I hadn’t realized is that in 2025 we hit the point where Meta - a single company - generates more ad revenue than THE WHOLE of the global linear TV industry.
And, yes, I know there’s more to TV than linear these days. But still, wow. Quite a moment!
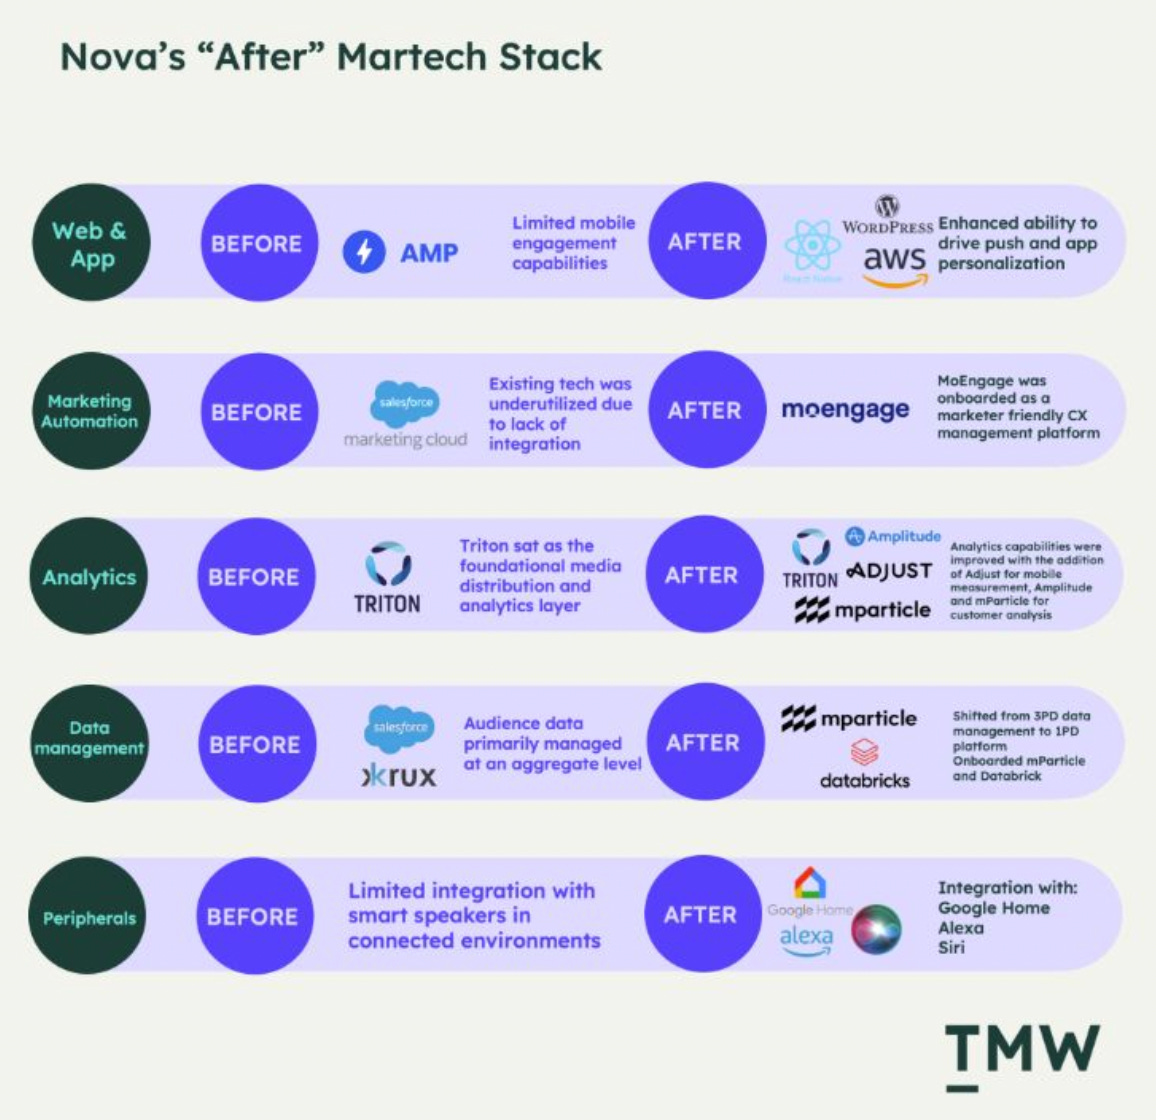
Speaking of reports, the 2024 Luma State of Digital was just published and it’s excellent. Very thorough, well produced and thought provoking. I love the idea of adtech as Peter Pan - refusing to grow up - and I agree with the need for rationalization.

That rationalization needs to come from end users (nonprofit Orgs) getting their tech stack audited to see what’s needed and what’s not. I’ve never seen a BEFORE/AFTER martech stack comparison and thought it was really well presented in this week’s The Martech Weekly newsletter, so I’ve dropped it below:
And as you probably know, Google Marketing Live was last week. It was a pretty decent event, with some new exciting product launches and updates.
As expected, most of it revolved around AI. Here are some of the biggest announcements:
Google will launch ads in AI Overviews.
Visual Search is getting an upgrade.
Google is doubling down on “The Power Pair” (Search + pMax).
New updates are coming to Shopping & pMax (ROI Optimization).
GenAI for creatives is gonna be pretty cool.
While it feels pretty obvious that traditional SEO methods won’t work with AI-powered search (I’ve heard plenty of estimates around the 20% mark for reduction in organic traffic), it’s still too early for the ad industry to have best practices around AI-powered search.
Here are some approaches I’m testing at the moment:
Adding more videos and images to websites E.G. converting text-based FAQs into videos, so the content will be more visible.
Google seems to be surfacing content more and more from sites like Reddit, so dedicating some resources/consideration time as to how to appear organically on these sites is time well spent.
At the moment, AI output tends to lean more informational than transactional. Not all searches prompt an AI overview response. There’s tons of value in conducting a content audit to analyze your gaps, especially around informational query-type content. Double win if you can draw insights from inquiries received through your Org’s donor services team and social listening efforts.
Also, mid-funnel queries that contain comparison questions for donations/use of funds/programs is where Orgs have an opportunity to capture potential impression or click loss coming from AI Overview too. Create content to answer these search queries.
Google also seems to have plans to combine generative AI search with its more conventional AI tool Performance Max, which uses AI to determine where ads should be placed to get the best results.
They’re calling the combo of Performance Max and Broad Match the “Ads Power Pair.” I’m sure Google would want us singing about how such advanced value-based bidding feature gives us more control. One day maybe but early tests seem at best inconclusive.
As SPN shares often: It’s Time to Experiment.
Jobs & Opps 🛠️
British Red Cross: Head of Funding Development, Compliance and Impact (£70,055 - £78,750)
Sesame Workshop: Social Media Director ($110,000 - $124,000)
UNFPA: Digital Fundraising Assistant (G-5)
Canadian Red Cross: Director, Monthly Giving ($90,118 - $131,422)
Modern Animal: Director, Growth Marketing ($165,000 - $225,000)
Lupus Foundation of America: Director, Digital Strategy
English National Opera: Philanthropy Manager (£30,000)
Children’s Institute: Director, Development ($104,616)
UN Women: Global Database on Violence against Women (Research Consultant)
Y.Labs: Deputy Director, Partnerships ($106,250 - $120,000)
Doctors Without Borders (USA): Associate Director, Stewardship & Engagement ($124,346 - $155,432)
Lymphoma Foundation: Director, Research, Grants & Initiatives ($100,000 – 120,000)
National Domestic Workers Alliance: Director, Social Media ($110,000 - $116,000)
Great Ormond Street: Senior Gaming Manager (£47,405)
Lego Foundation: Senior Specialist “Children on the Move”
What Does “Good” Look Like?
This post was inspired by an SPN reader who sent me some thought provoking questions in response to last week’s deep dive into how retention can boost acquisition and monetization via email. Thank you!
Here’s some context and questions I’ve wrestled with (and being on the hook for answering), while sitting in the co-pilot seat leading fund raising teams:
South Korea and Japan always seemed to have a 99.9% retention rate (ok, fine, not quite but it’s in the 90’s) – why can’t other markets get there?
Older donors seem to have a 20-30% higher retention rate – what are we doing wrong with younger segments?
Donors who got in on the Emergency Relief topic and immediately became monthly supporters had a 3-5x(!!!) lower retention rate - how off-kilter is our email cadence?
What target should Orgs be aiming for? The answers lay in the squishy middle of “it depends”. There’s no right retention number - it depends on multiple factors.
If you absolutely must see a number then anything over 65% for 12-months and 50% for 24-months retention strikes me as “healthy.”
More importantly, I hope we can agree that an Orgs retention is “good” if it’s improving.
Here’s how I’ve tried to understand what’s improving, and what levers to push and pull over time.
Step 1: Get an Understanding → Slice and Dice the Numbers
Looking at the “average retention rate” across all donors in all markets makes it unreasonably difficult to develop actionable improvement steps.
While it might be the metric the CFO is looking at, fund raising teams should look at retention separately by several dimensions.
Compile this intel and you’ll be streets ahead of most Orgs:
By Market – Country for global orgs and State for nationwide ones
By Cohort – how many months the person has been a monthly donor
By Segment – donor demographic “profile”
By Channel – whether they donated on the website, mailed a signed paper form, or picked up the phone
By Topic – was it a Restricted or Unrestricted revenue donor? Did they donate to a specific theme?
By Donation value – is there a difference in retention for donors donating $50/mo vs $150/mo.
These dimensions are critical for further personalization and should be understood through different lenses:
Market is mainly a reporting dimension. It’s good to keep track of to explain the “average” trend but it’s not very actionable.
Cohorts allow for the prioritization of groups of donors in the next step (Segment). I’d organize four cohorts of six months each
somebody who is a monthly donor for <6 months
6-12 months
13-18 months
19-24 months
and then, in addition, one “catch-all” cohort for loyal donors of 24+ months
Sticking with four Segments total – two age groups (under/over 45) + two genders.
Channel can be limited to Digital vs. Offline donors.
The number of Topics is Org-specific and most Orgs can fit their key ones in up to four categories.
Finally, donation value should be broken down into four quartiles.
Putting the Market dimension aside then, these 5 other dimensions create a matrix of 640 donor “groups” (because there are 5 Cohorts * 4 Segments * 2 Channels * 4 Topics * 4 Donation Value quartiles) for potential personalization.
Step 2: Prioritize the Dimensions
Personalization is critical to improving donor retention rates. In an ideal world, your Org would have access to the technology that allows you to at least test building personalized donor lifecycles for each of the 640 groups I calculated above.
This doesn’t mean you need whizz bang pop technology though. You do however need to experiment and to execute tests on the basis of the data you have in front of you.
1. Calculate the “relative difference” between each dimension’s worst and best group.
For example, if females under 45 have the lowest retention rate of 20%, and males over-45 have the highest retention rate of 60%, that’s a relative difference of 300%.
This relative difference is a proxy for potential improvement within each dimension
2. Rank the 5 dimensions above by the relative difference between the “best” and the “worst” examples.
Suppose Segment has a 300% relative difference, and Cohorts have a 400% relative difference between recurring donors for less than six months and donors for 19-24 months. In that case, the Cohort is more important than the Segment.
Picking just two helps limit the number of groups to personalize. And choosing the dimensions with the highest relative difference ensures the highest potential impact.
These 2 dimensions will be a “control group” to see the impact of further changes - focusing on the worst dimensions with the highest “relative difference” makes every improvement exponentially more apparent.
Step 3: Amp Your Storytelling
For example, if one of your “Worst Retention” segments is Emergency Donors then tests launched specifically for them should include:
Donor Lifecycle triggers
Send them a thank you email right after the donation, including the video of your Org’s staff helping people on the ground.
Send them a follow-on thank you email a month later, sharing the total amount of funds raised for this emergency.
Personal triggers
Send them an email if another emergency of the same kind happens.
Experiment with the headline and body of your email
Test hardcore donation requests versus informational emails with statistics around the emergency.
Experiment with frequency
Test sending daily emails with the emergency updates vs weekly total funding updates vs monthly impact reports.
Experiment with content types
Videos and imagery tend to work great with emergency donors.
OR, for example, if one of the segments with the worst retention is Young Donors who originally donated through Meta, you could explore the following:
Experiment with frequency
Younger donors usually tend to unsubscribe at much higher rates so decreasing the frequency is likely going to work better.
Experiment with the schedule
Donors under-45 tend to have higher employment rates, and sending emails on a weekday vs. a weekend, as well as before/after vs. during working hours, is guaranteed to have a different performance.
Show them a retargeting “Thank You” ad on Meta
Retention is not only about email - meet them in the channel where they already showed engagement with your Org.
Regardless of your Orgs’ “Worst Retention” segments, here are 7 “low hanging fruits” of Personalization to consider.
Personal triggers
Send Supporters an email on their birthday.
Send Supporters an email with your Org’s annual impact report.
Send Supporters the program impact report about the topic they donated to.
Donor lifecycle triggers
Send Supporters a donation email after they visit the website, but don’t donate.
Send Supporters a thank-you email after they donate, whether manually or every month after their automated donation clears.
Send Supporters a “personal impact” email on their anniversary as a donor.
Experiment with frequency
Try increasing it 2x and reducing it 2x compared to the baseline.
Experiment with the headline and body of your emails
Dial the urgency and CTA aggressiveness up and down vs. storytelling.
Experiment with the send schedule
Over the course of a month, day of week, and time of day.
Experiment with content types
Add video or image to the email.
Paid media
Show Supporters a retargeting ad in the channel where their first donation originated from.
All these triggers are available, and tests can be executed, in almost every email automation tool and don’t require enterprise-level tech. If any test positively impacts both dimensions selected above in Step 2, roll these changes out to the entire donor file.
There’s no unilaterally “good” retention rate for Orgs to aim for. Rolling through one test a week - as long as it shows an impact on the “worst” groups of donors - will boost your retention rate to as good as it can be. Context is critical.
That’s all for today!
If you enjoyed this edition, please consider sharing with your network. Thank you to those that do. If a friend sent this to you, get the next edition of SPN by signing up below.
And huge thanks to this Quarter’s sponsor Fundraise Up for creating a new standard for online giving.
Now onto the interesting stuff!
Reads From My Week
What Does a Chief AI Officer Look Like In the Modern Marketing World? (Ad Week)
Google “AI Overviews” - The End of Link-Based Search (Shelly Palmer)
Flybridge AI Index - Monitor the performance of public companies using AI (Fly Bridge)
How to Hire an Expert When You’re Not An Expert (LinkedIn)
Google’s Broken Link to the Web (Platformer)
China’s Tencent Posts Solid Revenue Growth As Ad Sales, Business Services Shine (Reuters)
Expectations vs. Reality (Edward Zitron)
Retailers’ Shelves Are Attractive Again. At Least for Skechers (WSJ)
Takeaways From the 2024 IAB Newfronts (PMG)
TikTok Tests 60-Minute Video Uploads (TechCrunch)
Putting Ads Without Third-Party Cookies To the Test: A Roadmap to Advertising Durability (AdExchanger)